Research Paper By Radhika M Menon
(Executive Coach, INDIA)
Out of chaos, comes Order! Friedrich Nietzsche
You love him or hate him, but you just cannot ignore Nietzhe. His second most famous quote perhaps is the one above, top of the list being,
God is dead!
In youth for most people, the quote was something like a heavy philosophical statement, which no denying, it is! But, now getting down to ‘demystifying’ this whole statement brings a whole lot of meaning and perspective to add value to one’s coaching journey.
To come to the topic of this article, scatter diagram or scatter plot is a mathematical tool used mostly in Quality systems. Origin of this tool goes back to Sir Francis Galton (1822 -1911) who was working with correlation among many other land mark discoveries and inventions.
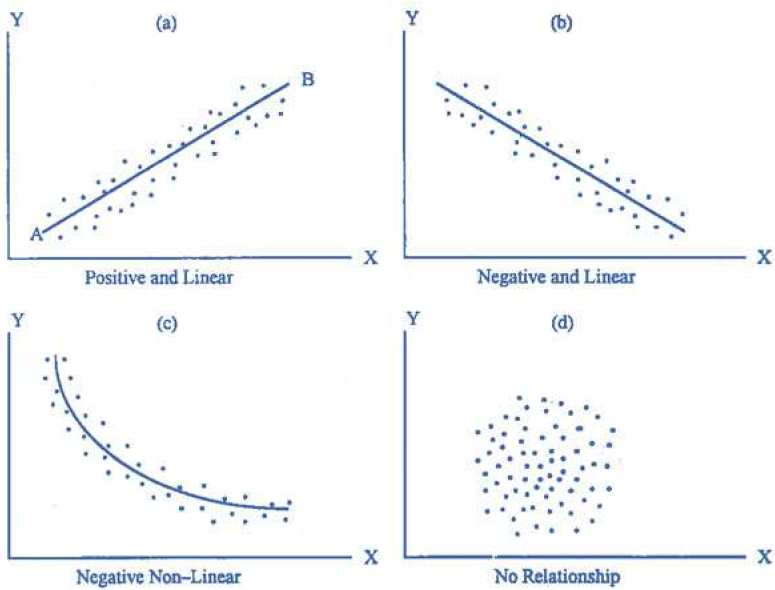
A scatter plot, also called a scatter diagram or a scattergram, is a basic graphic tool that illustrates the relationship between two variables. The dots on the scatter plot represent data points. See figure 1.1
Scatter plots are used with variable data to study possible relationships between two different variables. Even though a scatter plot depicts a relationship between variables, it does not indicate a cause and effect relationship. Use Scatter plots to determine what happens to one variable when another variable changes value. It is a tool used to visually determine whether a potential relationship exists between an input and an outcome.
In a coaching engagement, a client comes to the table with a collection of variable that are conceived in his or her mind or real and tangible that can either cause progress or create bottlenecks in their journey of goal actualization. Various coaching models work on this paradigm using relevant tools and techniques to arrange the scattered stuff into orderliness and even getting rid of irrelevant clutter. Depending on the coaches’ skills and experience this process can be both fun and enjoyable or deeply impacting emotional movement. These components or variables may or may not have a cause and effect relationship. But each can have a positive or negative impact on the output for any process.
Fig: 1.1
Tina works in a multinational company as Senior Manager, Marketing Division. Her job entails her to travel and work with global teams spread across time zones in different continents. She has a school going teenage daughter and husband who works as an independent professional. She has been nominated as a high potential in the corporation for coaching to improve her performance and work life balance.
In her mind, this is an additional item in her already choc a bloc calendar. She of late have been going through minor health issues that are triggered, according to her physician, because of stress more than anything and she would want to avoid this additional “to do” which would take up one half to two hours each fortnight for the next few months. Tina started looking for open windows where she could fit this item and found that all she could move was her time with family which was even more maddening for her because there was nothing from work that she could move in her calendar. The HR manager who was coordinating this initiative wasn’t being any helpful too. Finally she found some time to squeeze out for her first session with the coach.
In the 45 minute interaction with the coach Tina was counting out the many reasons why she just wasn’t going to be able to handle this additional appointment in the calendar. It was about ‘why not’ and no sign of ‘why she should’ make time for this very important initiative for which the organization was investing rather heavily. It made her comfortable though that the coach seemed to agree that she sure had a lot in her plate.

